On breaking waves and turbulence at the air-sea interface
Overview
When wind flows over the open sea, it creates surface waves. Most of the energy and momentum flux between the atmosphere and ocean passes through that wave field. Although some of this energy and momentum can be transported thousands of miles away by swell, the majority is injected locally.
Breaking surface waves, the “whitecaps” that can be seen on the sea surface any breezy day, are important. They are the dominant mechanism for wave energy dissipation and for momentum transfer from waves into mean currents. However, breaking is a complex nonlinear process with important physical scales (time and space) ranging over several orders of magnitude. This makes numerical modelling very difficult and actual measurements necessary.
My Ph.D. research consisted of a suite of laboratory and field experiments to study wave breaking.
Fieldwork
The three main deployments of R/P FLIP were in the Southern California Bight in December 2010, off the coast of Northern California in June 2010 (both part of the ONR-funded HiRes DRI), and south of Hawaii in September 2009 (part of the ONR-funded RaDyO experiment). The schematic below shows an example of the instruments deployed during these experiments
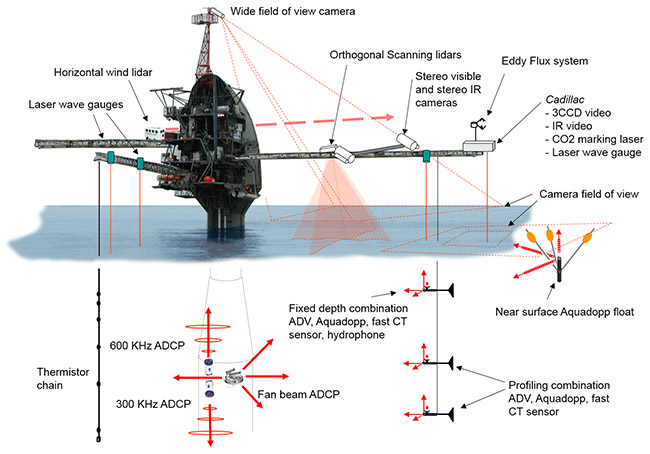
Instrument set-up aboard R/P FLIP. Experiments were designed to accurately measure the surface wave field over a range of scales from centimetres (stereo IR imaging) to 10s of meters (scanning lidar, wide field of view cameras) to kilometres (the HiRes experiment included an airborne remote sensing component). Currents were measured using upward and downward-looking ADCPs. Sub-surface turbulence was measured using an array of turbulence measurement devices – see below. Atmospheric fluxes and turbulence were measured using an eddy correlation system and a horizontal wind lidar.
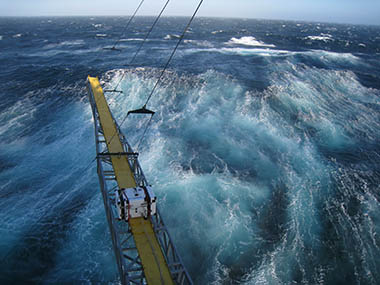
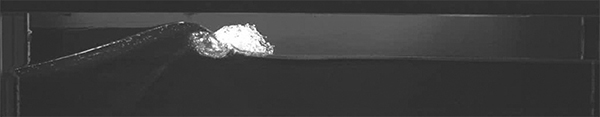
Bubble cloud left by a large breaking wave during the HiRes experiment off Northern California. For scale, the yellow boom in the image is 20m long. Winds were 16m/s and the significant wave height was 4m.
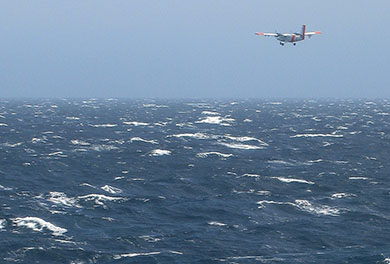
An instrumented Twin Otter flies past FLIP as part of the airborne component of the HiRes experiment.
Stereo IR sea surface analysis
A large component of my thesis has been the development and use of a stereo IR imaging system.
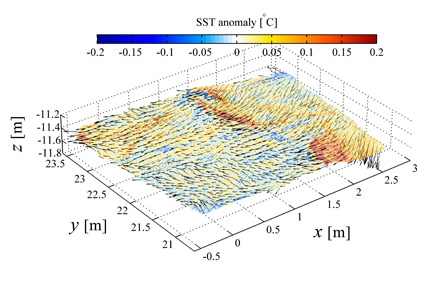
Stereo imagery uses image pairs taken by two cameras with a known location and orientation. By matching features in both images, it is then possible to triangulate the location of the features in 3D. Tracking features in consecutive images then allows calculation of the 3-dimensional velocity of the features. By using sensitive IR cameras, we were able to track thermal structures on the sea-surface. This allowed us to retrieve the displacement and velocity of the sea surface over an approximately 4x3 m patch.
The figure to the right shows an example of a reconstructed breaking wave. Colouring corresponds to temperature relative to a 20-minute average and the black arrows indicate the surface velocity.
Sub-surface turbulence measurements
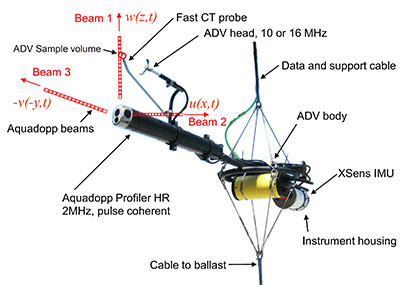
In order to gain an understanding of the turbulence and dissipation beneath breaking waves, we built an array of turbulence measurement devices that could be lowered from FLIP. Each device included a Nortek Aquadopp, an acoustic Doppler velocimeter, a fast conductivity and temperature sensor, and an inertial motion unit. All instruments were synchronized and data were streamed back to the onboard lab in real-time. During the RaDyO experiment, the device also included an underwater camera for characterizing light distortion beneath breakers.
Hydraulics Laboratory
Laboratory experiments allow controlled and repeatable conditions that are not available in the field. Early in my Ph.D. I used mechanically generated waves in the SIO hydraulics laboratory to study the dependence of dissipation wave-slope. Breakers were generated using dispersive focusing. By measuring the energy in a wave packet before and after breaking, it was possible to calculate the energy dissipated by breaking. Slope dependence was calculated by repeating the experiment with different slopes at breaking.
There was also a little time to play: